Amazon Q Business: Revolutionizing Visual Data Interpretation with AI
Co-author - Rahul Kumar P Amazon Q Business is the most capable generative AI-powered assistant for finding information, gaining insight, and taking action at work. It makes generative AI securely accessible to everyone in your organization, and helps your employees get work done faster. Anyone in the organization can use natural language to request information or assistance to generate content or create lightweight apps that automate workflows.
On December 1st, amidst the excitement of Re:Invent, Amazon unveiled a groundbreaking feature for Amazon Q Business. This innovative addition empowers users to extract information from various visual formats, including diagrams, infographics, charts, and image-based content. The launch extends Amazon Q Business’s capabilities to analyze visual elements embedded in PDFs, Microsoft PowerPoint and Word documents, as well as Google Docs and Google Slides.
One of the most compelling aspects of this feature is its accuracy and latency. Amazon Q Business pinpoints the specific images used to generate responses, allowing users to contextualize the extracted information effectively. This development marks a significant leap forward in AI-assisted document analysis, enabling users to query any type of content within a document, whether it’s graphical, visual, or textual.
Intrigued by the potential of this new feature, I decided to put it to the test.
Setting Up Amazon Q Business #
The setup process for Amazon Q Business was remarkably straightforward. With just a few clicks and a subscription plan, I was ready to explore its capabilities.
Testing Methodology #
To thoroughly evaluate this feature, I chose to analyze two types of documents:
- A research paper: “Can comets deliver prebiotic molecules to rocky exoplanets?” by R. J. Anslow, A. Bonsor, and P. B. Rimmer.
- A mock-up financial report.
These documents were selected for their rich content of graphs, diagrams, and tabular data, providing an ideal testing ground for Amazon Q Business’s visual interpretation capabilities.
Document Ingestion Process #
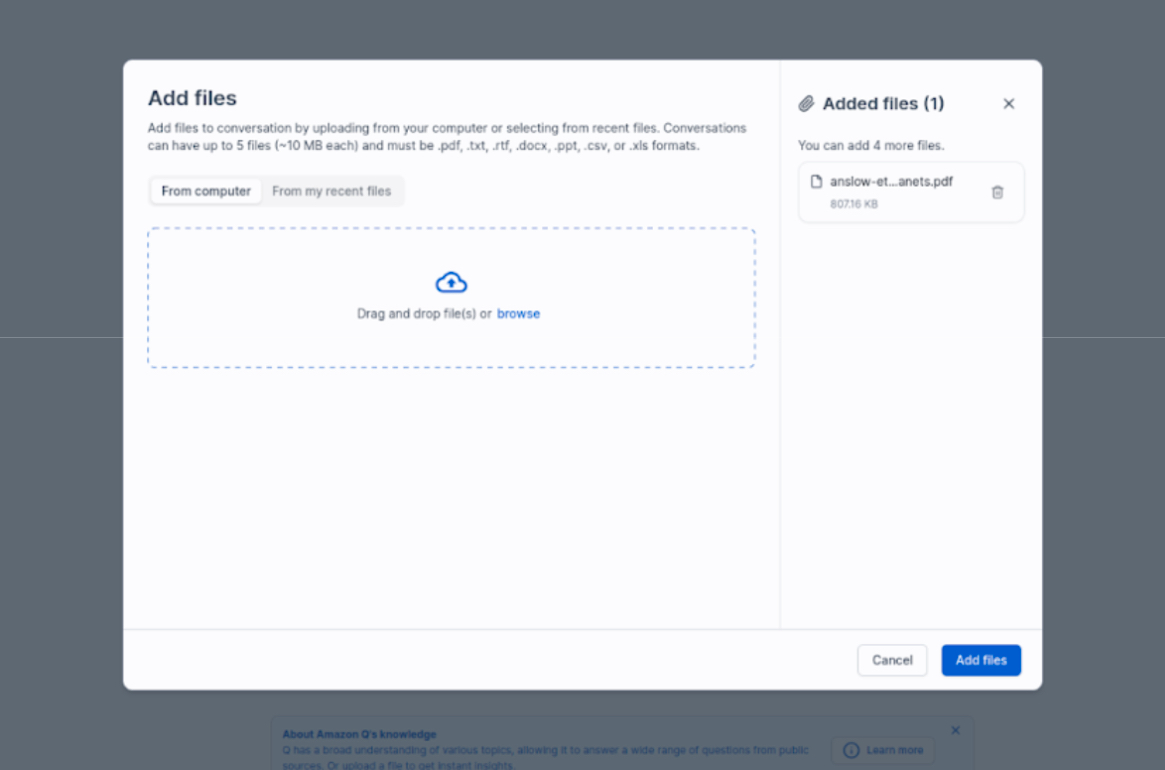
Uploading documents to Amazon Q Business is a simple process:
- Click the upload button on the chat prompt bubble.
- Either browse for files or use drag-and-drop functionality.
- Select the desired document (in this case, a PDF).
- Click “Add files” to complete the upload.
Testing Results #
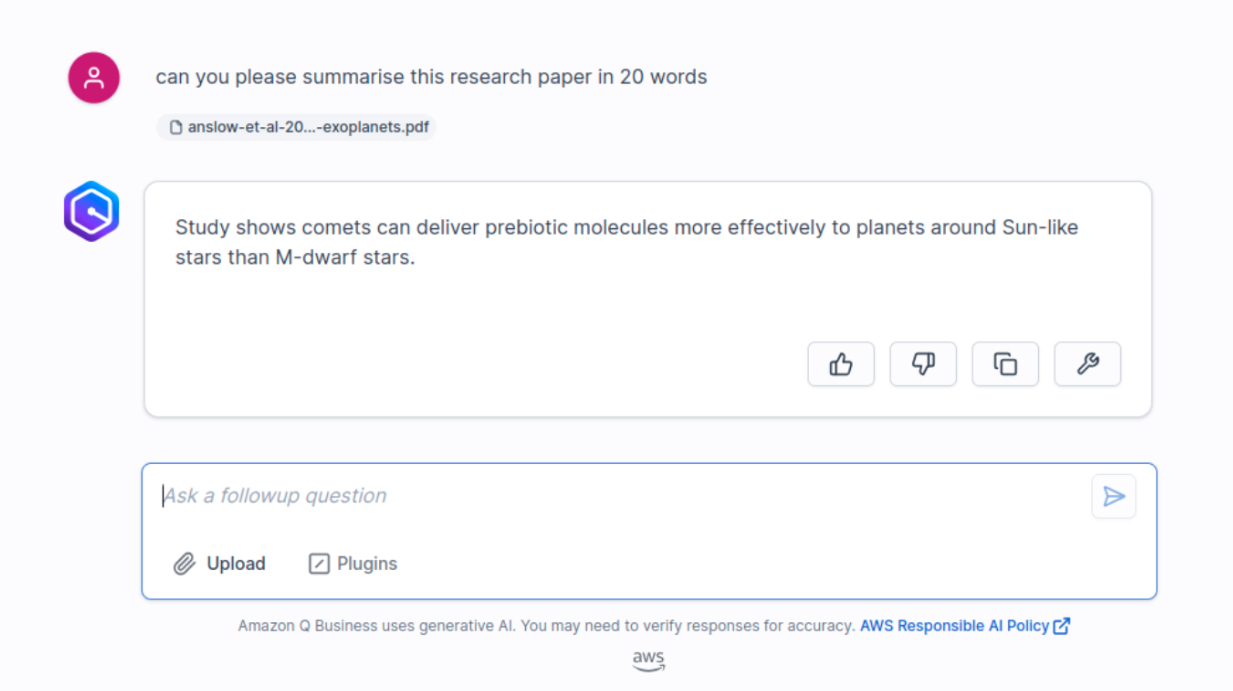
- Summarization:
When asked to summarize the research paper in 20 words, Amazon Q Business provided a concise and accurate summary.
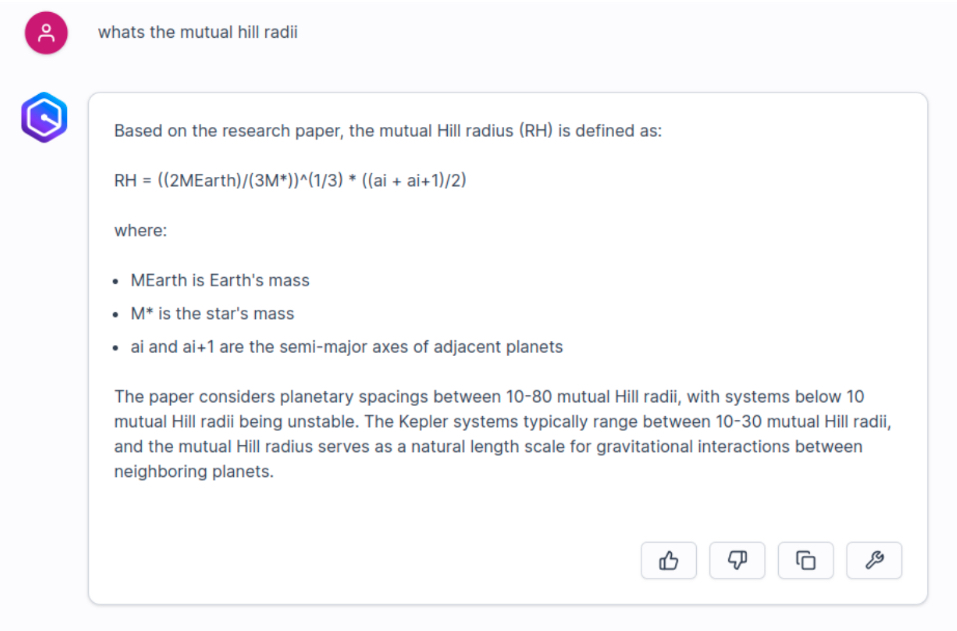
- Visual Insights:
Amazon Q Business demonstrated an impressive ability to interpret complex figures, providing clear and informative responses.
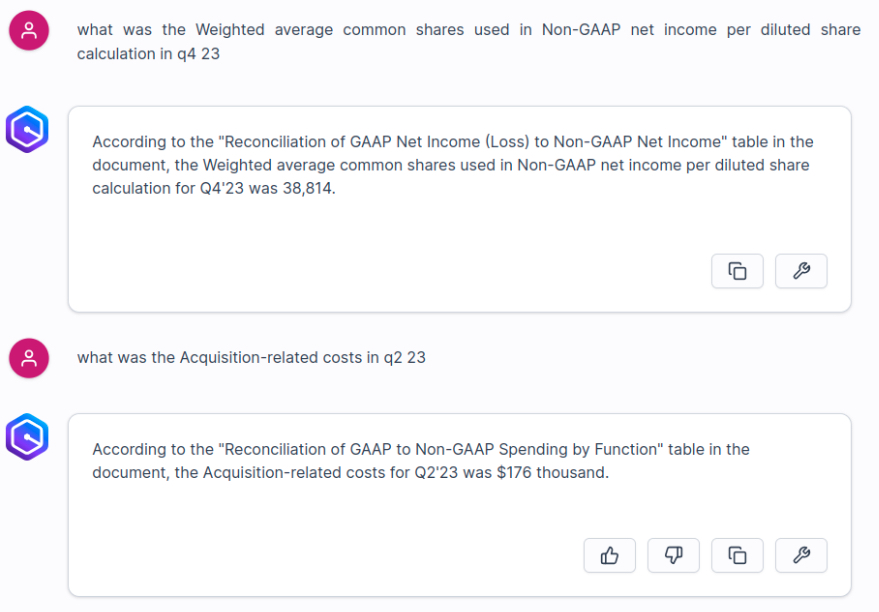
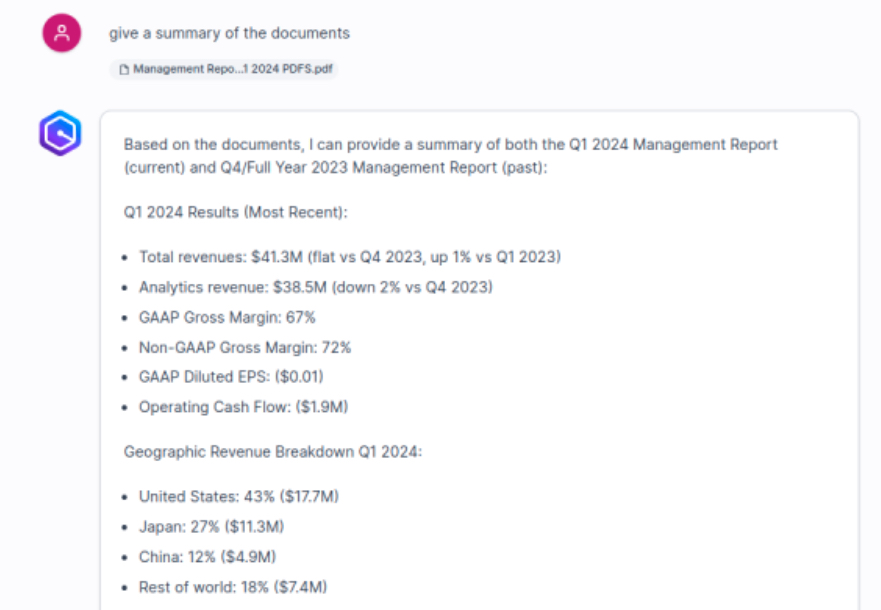
- Financial Data Analysis:
The AI showed proficiency in handling both simple queries about specific data points and more complex, interpretative questions about financial information.
- Multi-Document Analysis:
When presented with multiple financial reports containing overlapping data, Amazon Q Business maintained accuracy and clarity in its responses, even to ambiguous questions.
Key Findings #
- Excellent interpretation of diagrams and visual graphics
- Accurate analysis of tabular data, even with overlapping information across documents
- Effective summarization of multiple documents within given constraints
- Honest acknowledgment of limitations when data points were unclear
- Impressive handling of ambiguous queries
Conclusion #
Amazon Q Business’s new visual interpretation feature represents a significant advancement in AI-assisted document analysis. Its ability to extract and contextualize information from various visual formats, combined with its user-friendly interface and transparent approach, makes it a powerful tool for professionals across various industries. As AI continues to evolve, tools like Amazon Q Business are set to transform how we interact with and derive insights from complex documents.