CloudWatch Custom Log Filter Alarm For Kinesis Load Failed Event
Kinesis Firehose is pushing the realtime data to S3, Redshift, ElasticSearch, and Splunk for realtime/Near real-time analytics. Sometime the target may not available due to maintenance or any reason. So the Kinesis will automatically push the data to S3 and create the manifest file in the errors directory. Then later we can reload the data into our targets. But unfortunately, there is no one-step action to set notification if the load is failed. In this blog, im writing how can we setup Cloudwatch custom log filter alarm for kinesis load failed events.
Kinesis Firehose Setup: #
Im sending my clickstream data to Kinesis Firehose and then there is an intermediate S3 bucket to store the data in JSON format with GZIP compression. And then the data will go to RedShift for further analytics purpose.
RedShift Failures in Kinesis: #
Kinesis will not send the data to Redshift in many cases. Here are some most common errors.
- Redshift.AuthenticationFailed
- Redshift.ConnectionFailed
- Redshift.ReadOnlyCluster
- Redshift.DiskFull
There are many other errors you can refer to the below Reference section to read more about the types of errors.
Customer Log Filter in CloudWatch: #
To setup the email notification, we need to filter the Cloudwatch logs with the keyword errorCode and RedShift.
- Go to Cloudwatch –> Logs
- Click the radio button on
/aws/kinesisfirehose/your-stream-name - Create Metric Filter.
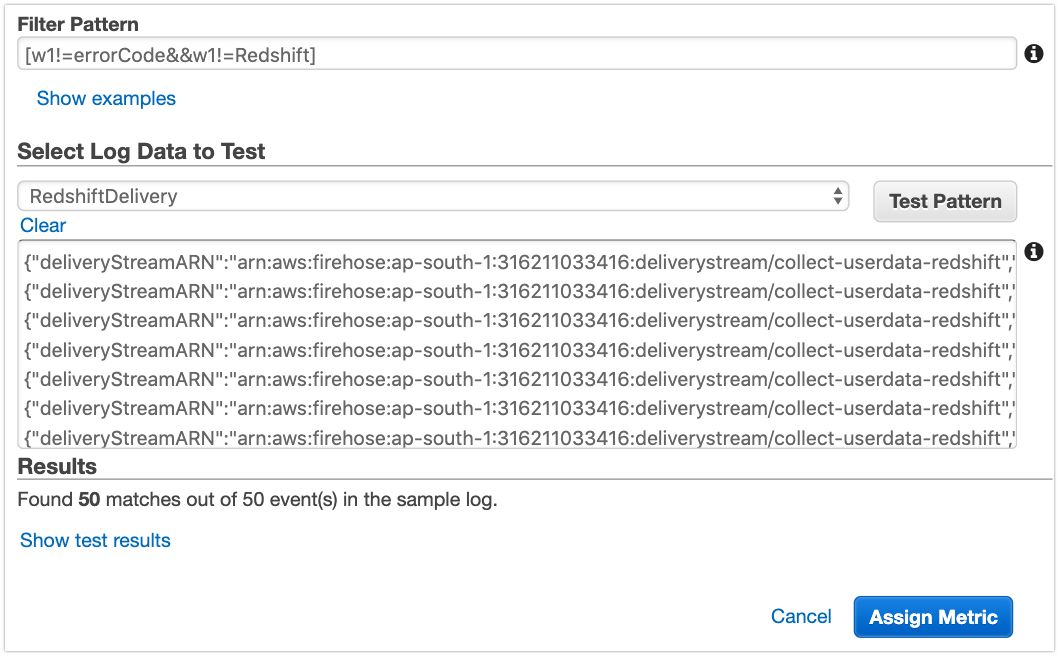
- Filter Pattern:
[w1!=errorCode&&w1!=Redshift]( This means the string errorCode and RedShift will be on the same line). - Select Log Data to Test: RedShiftDelivery
- Test pattern. (it’ll give you some X number of matching lines)
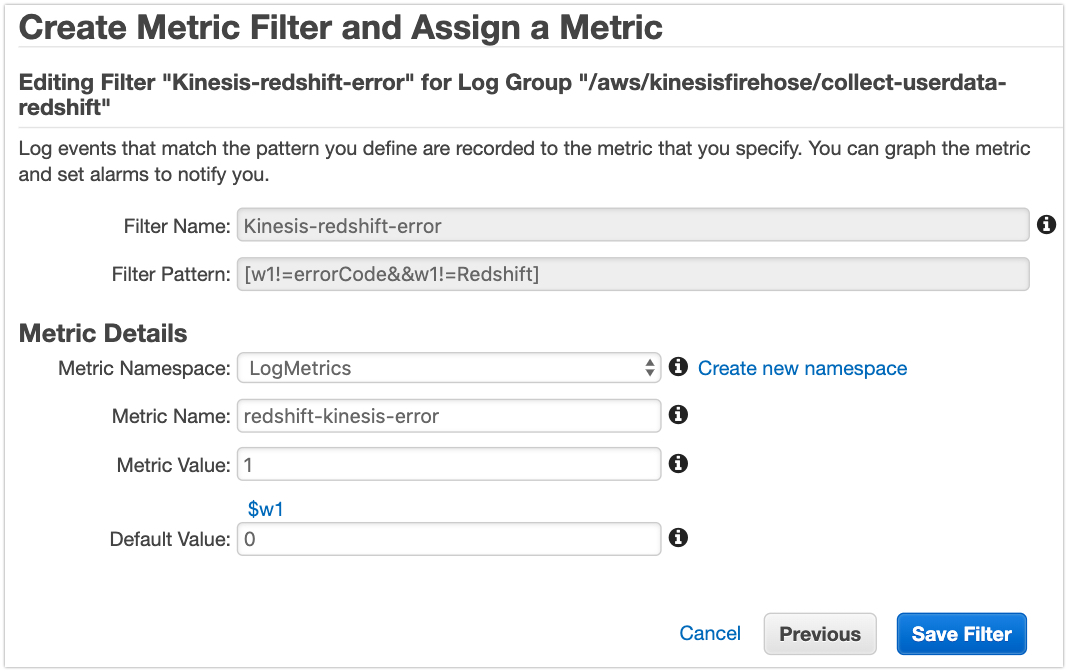
Now assign the metric.
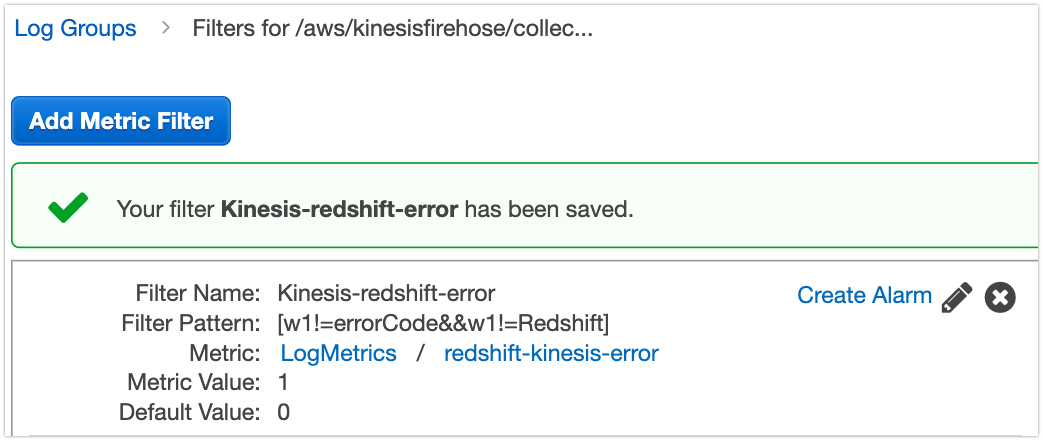
- Filter Name: kinesis-redshift-error
- Filter Pattern: it’ll automatically select the pattern which we used in the previous step.
- Metic Name: redshift-kinesis-error
- Metic Value: 1
- Click on the save filter.
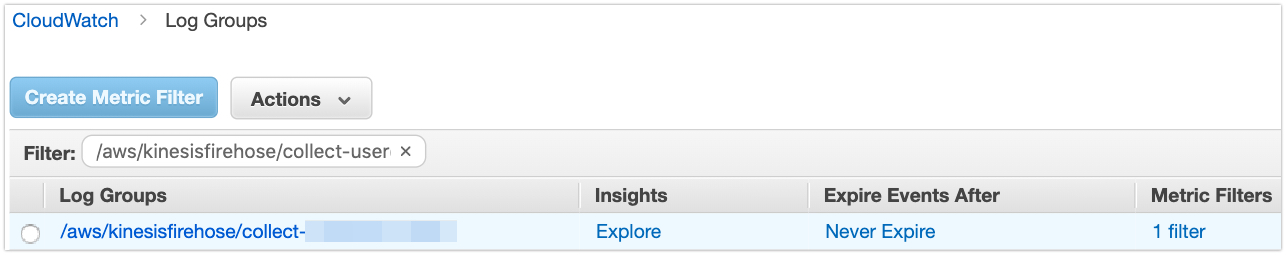
Create the Alarm: #
Once the clicked the Save Filter option you can see the window. Or you go to Cloudwatch –> logs –> /aws/kinesisfirehose/your-stream-name on Metric Filters column you can see 1 filter.
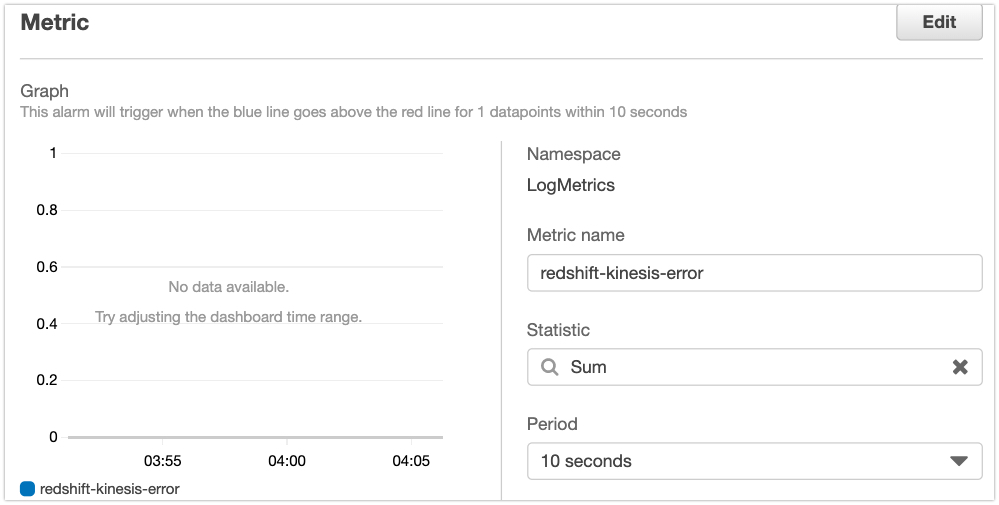
- Click on the Create Alarm link.
- Under the metric option: select the period as 10 seconds.
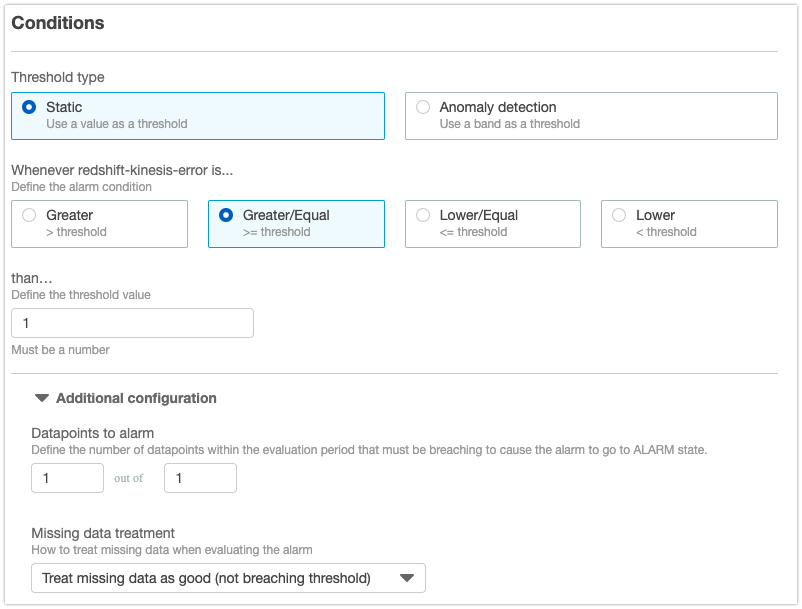
- Conditions: Threshold type –> Static
- Define the alarm condition –> Greater/Equal
- Define the threshold value –> 1
- Under the Additional Configuration: Datapoints to alarm
1 out of 1 - Missing data treatment: Treat Missing Data as Good.
- Rest of the things are easy, you can select an SNS topic for sending an email alert.
Why Treat Missing Data as Good? #
In the Cloudwatch, we’ll not get any logs unless kinesis gets some errors. So it’ll not get any values for the metric. Then your alarm will go to insufficient state. We are interested in only getting email alerts. So if my CloudWatch didn’t get any errors then this Alarm will go to OK state.
Test this Alarm: #
For testing purpose, I changed my redshift password in Kinesis Firehose. Then I got this error from the Cloudwatch.
CloudWatch Log:
{
    "deliveryStreamARN": "arn:aws:firehose:ap-south-1:XXXXXXXX/Kinesis-test-stream",
    "destination": "jdbc:redshift://XXXXXXXXXX.redshift.amazonaws.com:5439/test",
    "deliveryStreamVersionId": 11,
    "message": "The provided user name and password failed authentication. Provide valid user name and password.",
    "errorCode": "Redshift.AuthenticationFailed"
}
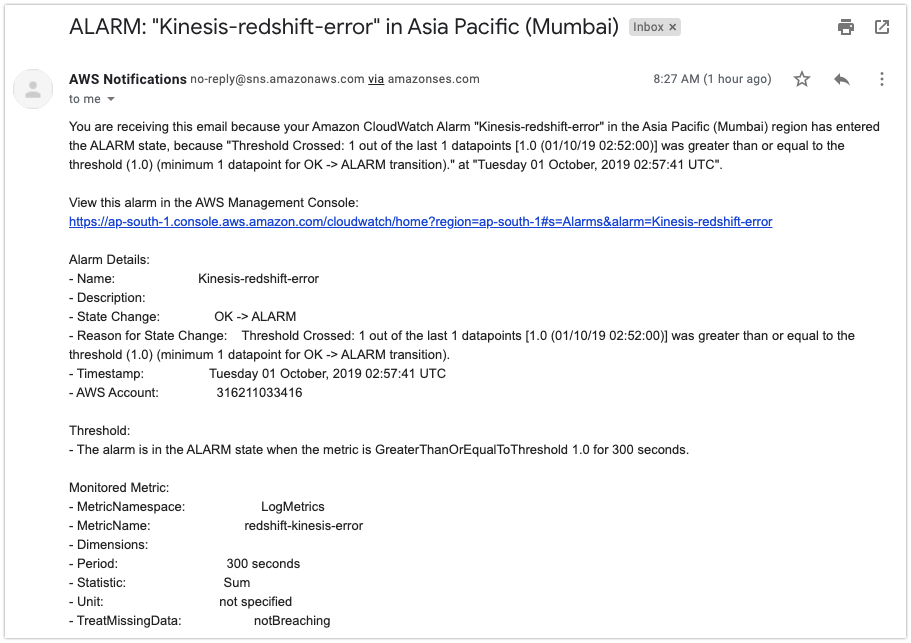
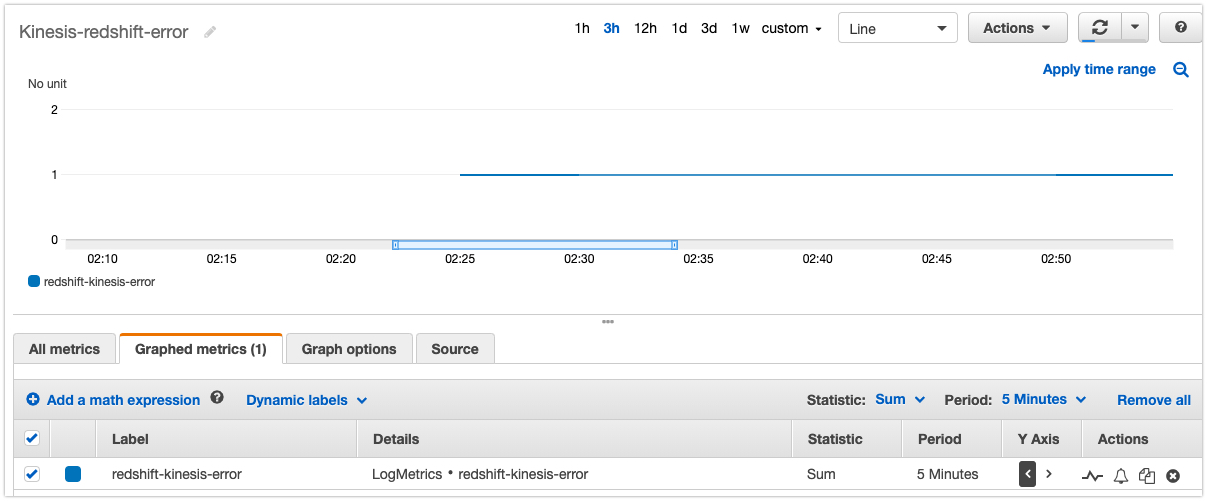
CloudWatch Alarm:
You can see a blue line or a blue dot which indicates that the pattern matched.
Email:
Yes, and I got the email from SNS topic.