Monitor Debezium MySQL Connector With Prometheus And Grafana
Debezium is providing out of the box CDC solution from various databases. In my last blog post, I have published how to configure the Debezium MySQL connector. This is the next part of that post. Once we deployed the debezium, to we need some kind of monitoring to keep track of whats happening in the debezium connector. Luckily Debezium has its own metrics that are already integrated with the connectors. We just need to capture them using the JMX exporter agent. Here I have written how to monitor Debezium MySQL connector with Prometheus and Grafana. But the dashboard is having the basic metrics only. You can build your own dashboard for more detailed monitoring.
Reference: List of Debezium monitoring metrics
Install JMX exporter in Kafka Distributed connector: #
All the connectors are managed by the Kafka connect(Distributed or standalone). In our previous blog, we used Distributed Kafka connect service. So we are going to modify the distributed service binary file.
Download the JMX exporter.
mkdir/opt/jmx/
cd /opt/jmx/
wget https://repo1.maven.org/maven2/io/prometheus/jmx/jmx_prometheus_javaagent/0.12.0/jmx_prometheus_javaagent-0.12.0.jar
mv jmx_prometheus_javaagent-0.12.0.jar jmx-exporter.jar
Create config file.
vi /opt/jmx/config.yml

startDelaySeconds: 0
ssl: false
lowercaseOutputName: false
lowercaseOutputLabelNames: false
rules:
- pattern : "kafka.connect<type=connect-worker-metrics>([^:]+):"
  name: "kafka_connect_connect_worker_metrics_$1"
- pattern : "kafka.connect<type=connect-metrics, client-id=([^:]+)><>([^:]+)"
  name: "kafka_connect_connect_metrics_$2"
  labels:
    client: "$1"
- pattern: "debezium.([^:]+)<type=connector-metrics, context=([^,]+), server=([^,]+), key=([^>]+)><>RowsScanned"
  name: "debezium_metrics_RowsScanned"
  labels:
    plugin: "$1"
    name: "$3"
    context: "$2"
    table: "$4"
- pattern: "debezium.([^:]+)<type=connector-metrics, context=([^,]+), server=([^>]+)>([^:]+)"
  name: "debezium_metrics_$4"
  labels:
    plugin: "$1"
    name: "$3"
    context: "$2"
Add the JMX export to the Kafka connect binary File.
vi /usr/bin/connect-distributed

-- Find this line below export CLASSPATH
exec $(dirname $0)/kafka-run-class $EXTRA_ARGS org.apache.kafka.connect.cli.ConnectDistributed "$@"

--Replace with
exec $(dirname $0)/kafka-run-class $EXTRA_ARGS -javaagent:/opt/jmx/jmx-exporter.jar=7071:/opt/jmx/config.yml org.apache.kafka.connect.cli.ConnectDistributed "$@"
Restart the Distributed Connect Service.
systemctl restart confluent-connect-distributed
Verify the JMX Agent installation.
netstat -tulpn | grep 7071
tcp6       0      0 :::7071                 :::*                    LISTEN      2885/java
Get the debezium metrics.
curl localhost:7071 | grep debezium
:-debezium_metrics_NumberOfDisconnects{context="binlog",name="mysql-db01",plugin="mysql",} 0.
You can these metrics in your browser as well.
http://ip-of-the-connector-vm:7071/metrics
Install Prometheus #
Im using a separate server for Prometheus and Grafana.
Create a user for Prometheus:
sudo useradd --no-create-home --shell /bin/false prometheus
Create Directories for Prometheus:
sudo mkdir /etc/prometheus
sudo mkdir /var/lib/prometheus
sudo chown prometheus:prometheus /etc/prometheus
sudo chown prometheus:prometheus /var/lib/prometheus
Download the Prometheus binary files:
cd /tmp
wget https://github.com/prometheus/prometheus/releases/download/v2.15.0/prometheus-2.15.0.linux-amd64.tar.gz
tar -zxvf prometheus-2.15.0.linux-amd64.tar.gz
Copy the binary files to respective locations:
cd prometheus-2.15.0.linux-amd64
cp prometheus /usr/local/bin/
cp promtool /usr/local/bin/
sudo chown prometheus:prometheus /usr/local/bin/prometheus
sudo chown prometheus:prometheus /usr/local/bin/promtool
cp -r consoles /etc/prometheus
cp -r console_libraries /etc/prometheus
sudo chown -R prometheus:prometheus /etc/prometheus/consoles
sudo chown -R prometheus:prometheus /etc/prometheus/console_libraries
Create a Prometheus config file:
vi  /etc/prometheus/prometheus.yml

global:
  scrape_interval: 15s

scrape_configs:
  - job_name: 'prometheus'
    scrape_interval: 5s
    static_configs:
      - targets: ['localhost:9090']
Set permission for config file:
sudo chown prometheus:prometheus /etc/prometheus/prometheus.yml
Create a Prometheus systemctl file:
vi /etc/systemd/system/prometheus.service

[Unit]
Description=Prometheus
Wants=network-online.target
After=network-online.target

[Service]
User=prometheus
Group=prometheus
Type=simple
ExecStart=/usr/local/bin/prometheus \
    --config.file /etc/prometheus/prometheus.yml \
    --storage.tsdb.path /var/lib/prometheus/ \
    --web.console.templates=/etc/prometheus/consoles \
    --web.console.libraries=/etc/prometheus/console_libraries

[Install]
WantedBy=multi-user.target
Start the Prometheus Service:
sudo systemctl daemon-reload
sudo systemctl start prometheus
sudo systemctl enable prometheus
Add Debezium MySQL connector metrics to Prometheus:
vi  /etc/prometheus/prometheus.yml


  - job_name: debezium
    scrape_interval: 5s
    static_configs:
      - targets:
          - debezium-node-ip:7071
Restart the Prometheus service:
sudo systemctl restart prometheus
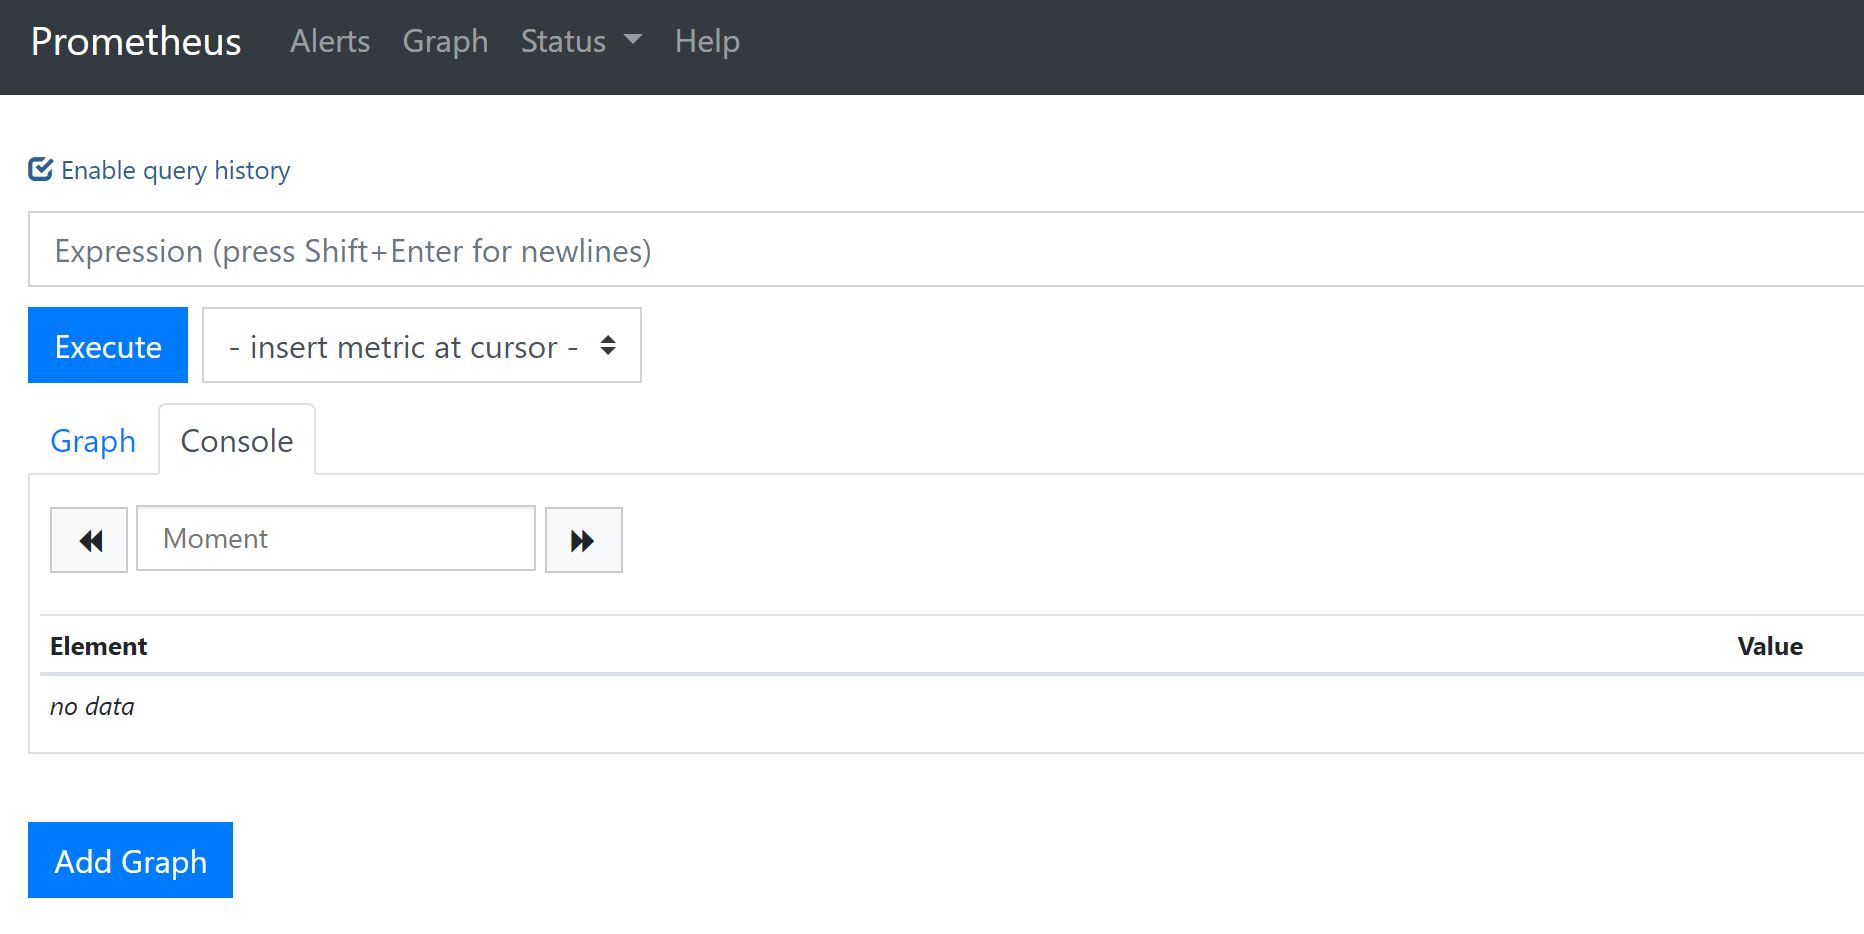
Check the status:
In your browser Open the below URL.
http://IP_of-prometheus-ec2:9090/graph
Install Grafana: #
wget https://dl.grafana.com/oss/release/grafana_6.5.2_amd64.deb
sudo dpkg -i grafana_6.5.2_amd64.deb
sudo systemctl daemon-reload
sudo systemctl start grafana-server
It’ll start listening to the port 3000. The default username and password admin/admin. You can change once you logged in.
http://grafana-server-ip:3000
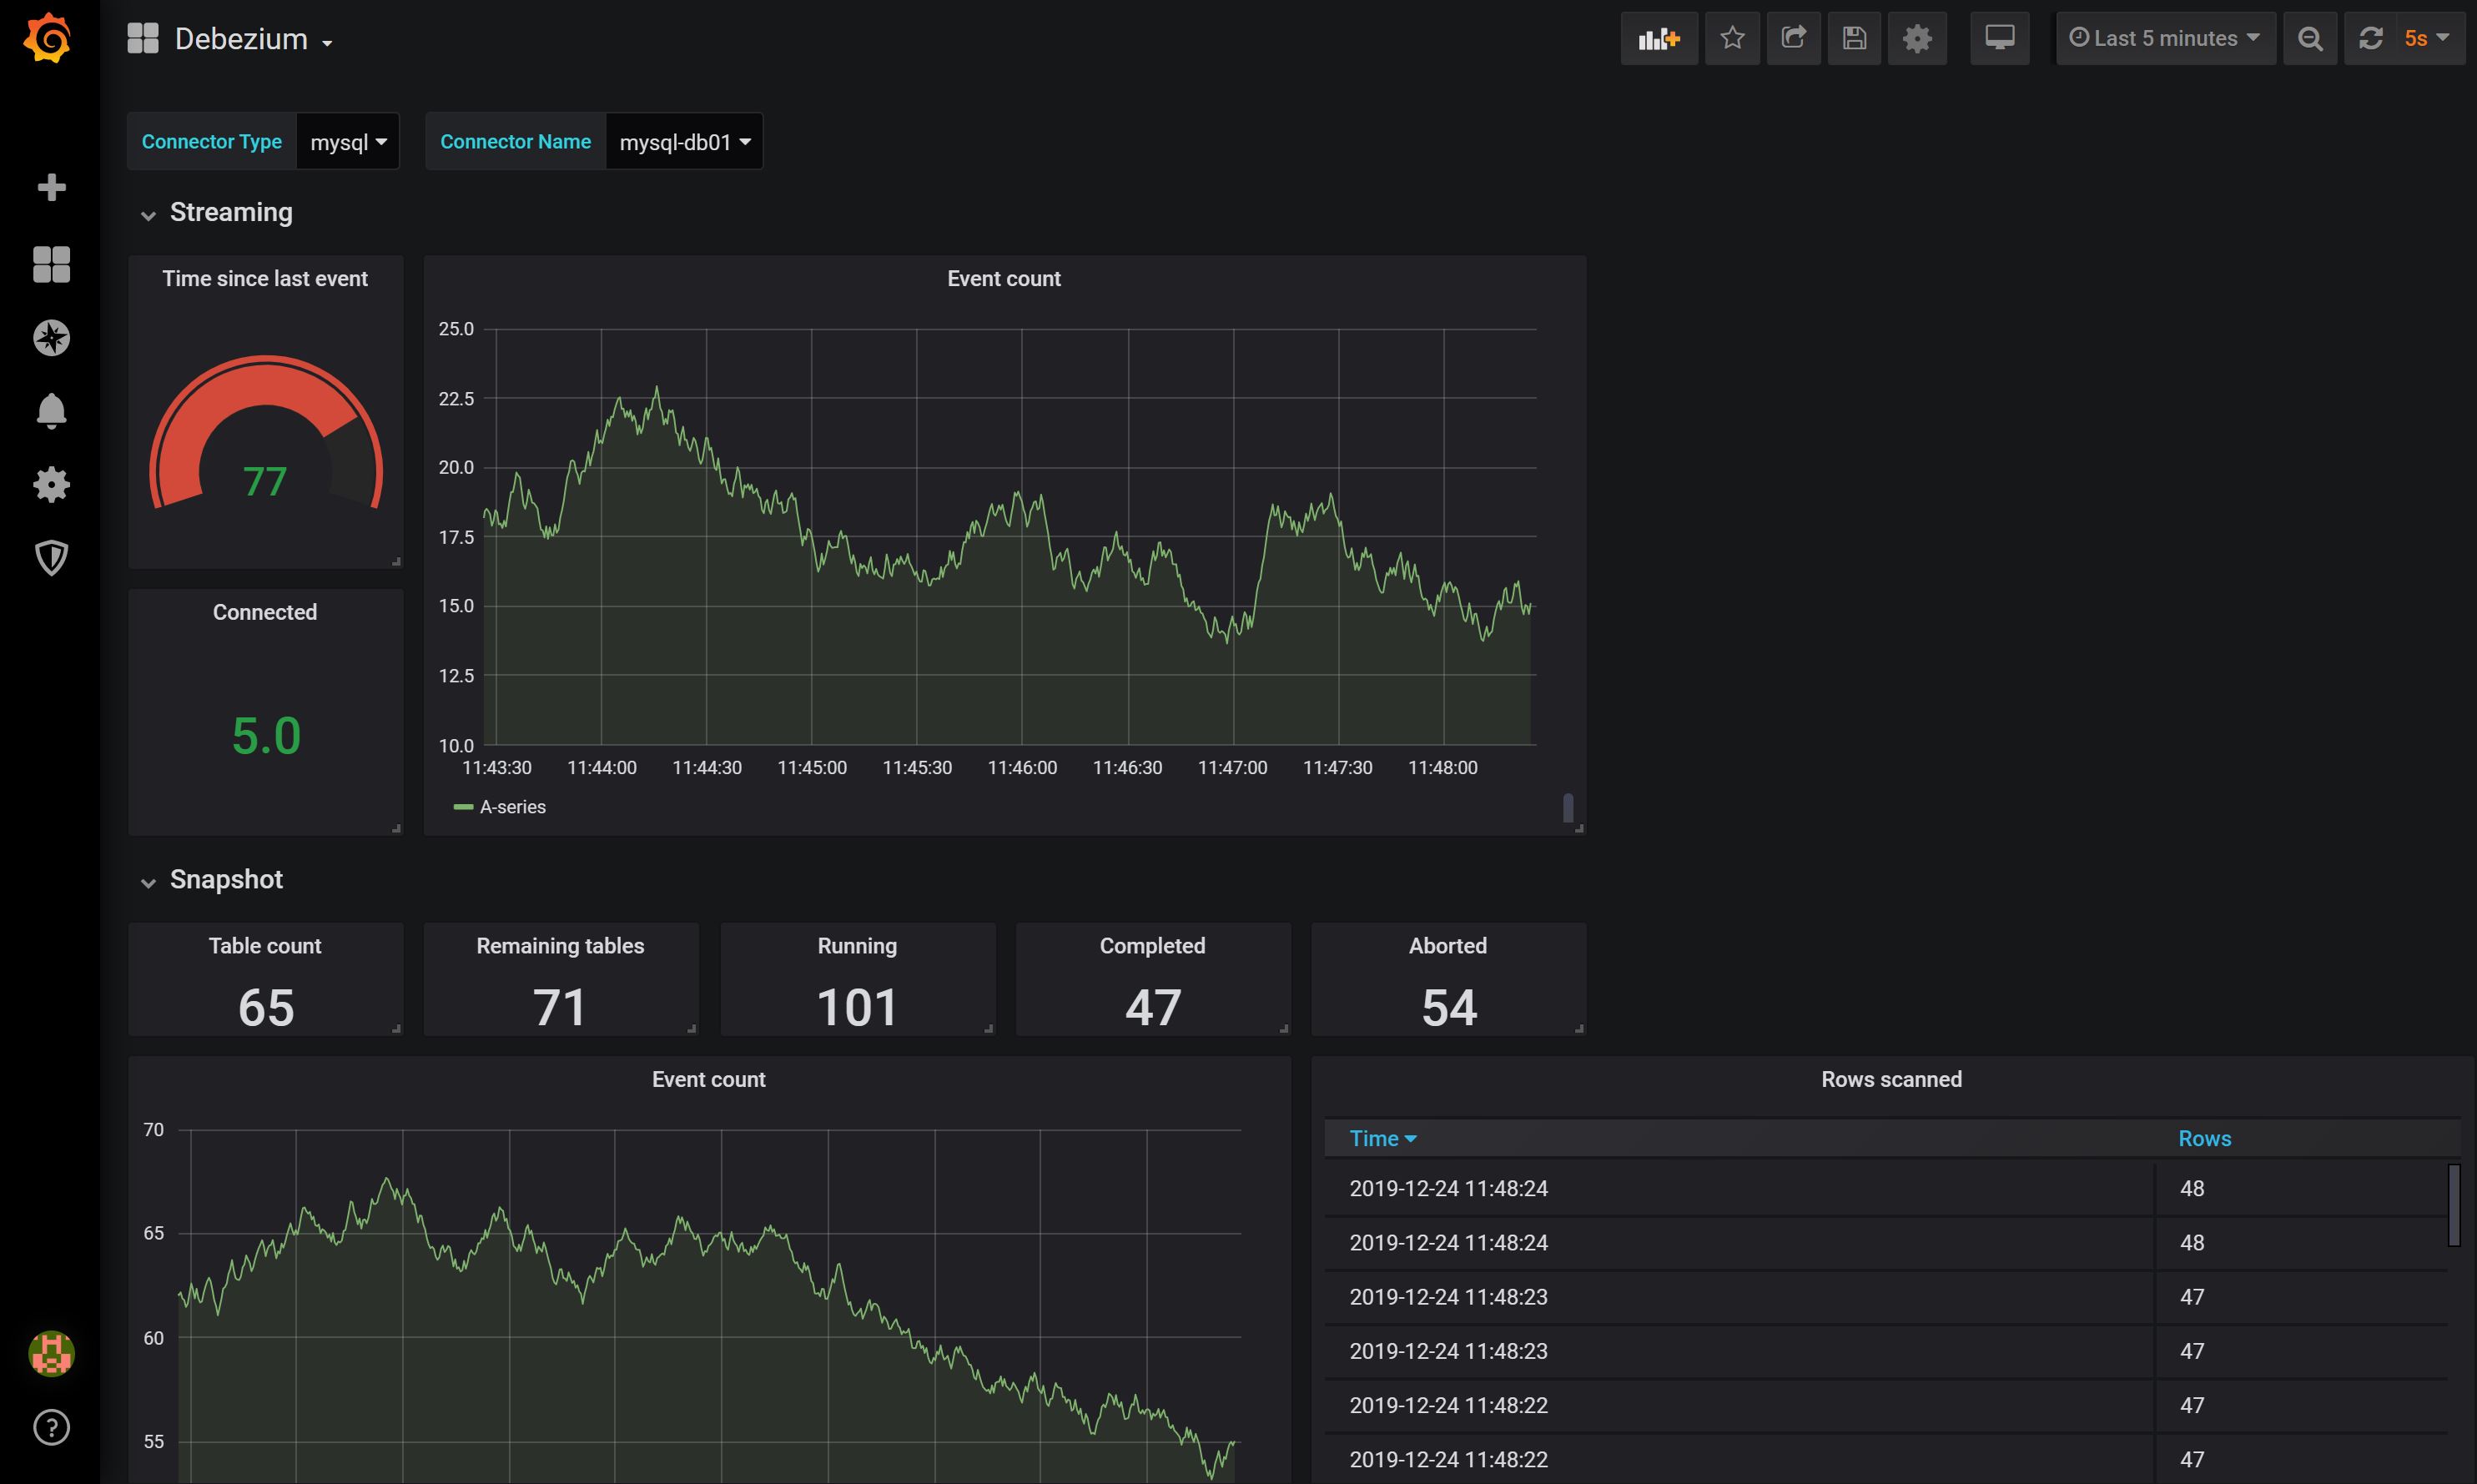
Add the Debezium MySQL Dashboard:
This dashboard is taken from the official Debezium’s example repo. But they gave this for MSSQL Server. With some changes and fixes, we can use the same for MySQL and other databases. I made it as a template.
In grafana add the Prometheus datasource.
http://grafana-ip:3000/datasources
Click on Add Data source, select Prometheus.
- Name: Prometheus
- URL: localhost:9090 (I have installed grafana and Prometheus on the same server, If you have different server for Prometheus, use that IP instead of localhost).
Click on Save & Test.
You’ll get a pop-up message that its is connected.
Now go to the dashboards page and import the Template JSON.
http://grafan-ip:3000/dashboards
Click on Import button.
Copy the Template JSON file from here. Paste it or download the JSON file and choose the upload button. Now the dashboard is ready. You can see a few basic metrics.
Contribution: #
Debezium is a great platform for who wants to do real-time analytics. But in terms of monitoring, still, I feel it should get more contribution. This template is just a kickstart. We can build a more detailed monitoring dashboard for the debezium connectors. Please feel free to contribute to repo. Pull requests are welcome. Lets make the debezium more powerful.
Debezium Series blogs: #
- Build Production Grade Debezium Cluster With Confluent Kafka
- Monitor Debezium MySQL Connector With Prometheus And Grafana
- Debezium MySQL Snapshot From Read Replica With GTID
- Debezium MySQL Snapshot From Read Replica And Resume From Master
- Debezium MySQL Snapshot For AWS RDS Aurora From Backup Snaphot
- RealTime CDC From MySQL Using AWS MSK With Debezium