Monitor Cassandra Clusters with Percona PMM - JMX Grafana and Prometheus
While reading this title you may think about what this guy is going to do? Its all about JMX exporter from prometheus and Grafana. Yes, its already implemented by many companies and Grafana has some cool dashboards. But as a DBA, in Searce we are managing many customers and all of them are using many types of databases. So from a DBA’s perspective to monitor all databases in one place is always a great thing right. If you are a MySQL DBA, then you must have heard about PMM. Its an awesome monitoring tool and its open source. Also it has Dashboards for Linux metrics, MongoDB and PostgreSQL.
I remember, 2 years back(2017) I was trying to setup monitoring for a huge Cassandra cluster with MX4J. It was very hard that time to understand the metrics. But now, when I stated using PMM, I became a big fan of it. So I want to integrate the Cassandra monitoring dashboard with PMM.
Before starting this, I was searching about how JMX exporter is behaving and will make any trouble for my cluster and etc. Unfortunately it does in few cases. Then I found this amazing custom JMX exporter which is developed by Criteo. Its has better control over the metrics. So I decided to use this.
Stage 1: Install cassandra_exporter #
You don’t need to change anything from your Cassandra’s setting or cassandra-env.sh
Download the exporter: #
mkdir /opt/cassandra_exporter
cd  /opt/cassandra_exporter
wget https://github.com/criteo/cassandra_exporter/releases/download/2.2.1/cassandra_exporter-2.2.1-all.jar
mv cassandra_exporter-2.2.1-all.jar  cassandra_exporter.jar
Create config file #
vi config.yml
host: localhost:7199
ssl: False
user:
password:
listenAddress: 0.0.0.0
listenPort: 8080
blacklist:
   - java:lang:memorypool:.*usagethreshold.*
   - .*:999thpercentile
   - .*:95thpercentile
   - .*:fifteenminuterate
   - .*:fiveminuterate
   - .*:durationunit
   - .*:rateunit
   - .*:stddev
   - .*:meanrate
   - .*:mean
   - .*:min
   - com:criteo:nosql:cassandra:exporter:.*

maxScrapFrequencyInSec:
  10:
    - .*
  300:
    - .*:snapshotssize:.*
    - .*:estimated.*
- .*:totaldiskspaceused:.*- blacklist - These metrics are never been collected.
- maxScrapFrequencyInSec - Metrics collection frequency.
- Here all the metrics are collected every 10sec and metrics are under 300 are collected every 300 sec.
Start the Exporter: #
I have executed this using nohup but you can create a service for this.
nohup java -jar /opt/cassandra_exporter/cassandra_exporter.jar config.yml &Stage 2: #
Install and Configure PMM Server: #
docker pull percona/pmm-server:1

docker create \
   -v /opt/prometheus/data \
   -v /opt/consul-data \
   -v /var/lib/mysql \
   -v /var/lib/grafana \
   --name pmm-data \
   percona/pmm-server:1 /bin/true

docker run -d \
   -p 80:80 \
   --volumes-from pmm-data \
   --name pmm-server \
   --restart always \
   percona/pmm-server:1
More customized installation: https://www.percona.com/doc/percona-monitoring-and-management/deploy/server/docker.setting-up.html
Install PMM Client on all Cassandra Nodes: #
DEB Package:
wget https://repo.percona.com/apt/percona-release_latest.generic_all.deb
dpkg -i percona-release_latest.generic_all.deb
apt-get update
apt-get install pmm-client
RPM Package:
sudo yum install https://repo.percona.com/yum/percona-release-latest.noarch.rpm
yum install pmm-client
Add Cassandra Node to PMM Server: #
pmm-admin config --server PMM-Server-IPEnable Linux Metrics:
It contains common linux monitoring metrics. So 42000 port should be opened to the PMM server.
pmm-admin add linux:metricsStage 3: Add Cassandra to PMM #
PMM is having a feature called External services, So the PMM will capture the metrics from your own external services. Enable the Cassandra metrics as an external service.
In config.yml file, we have added the listen port as 8080, so our external service will use this port to get the metrics. And this 8080 port should be opened to the PMM server.
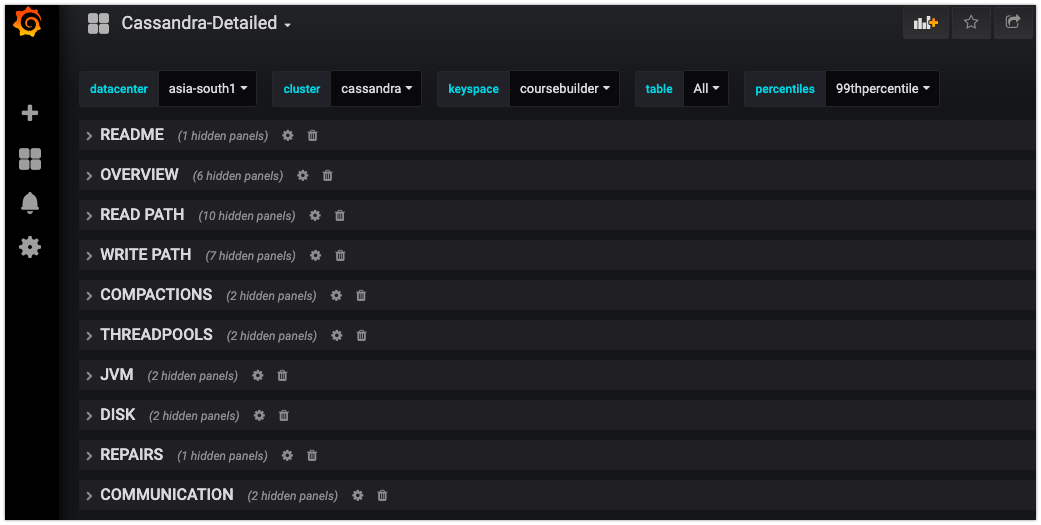
pmm-admin add external:service cassandra --service-port=8080Now, metrics are collecting by PMM, but we can’t visualize this without the proper Dashboard. So the critro team has already build a dashboard and published it in Grafana repo. So we can import it from there.
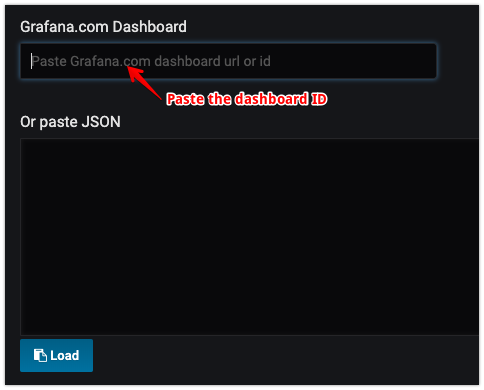
- Go to Grafana -> Click on Plus(+) button -> Import.
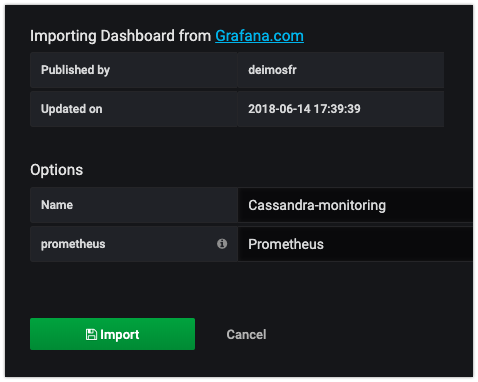
- Paste this dashboard id here:
6400 - Click Prometheus as datasource.
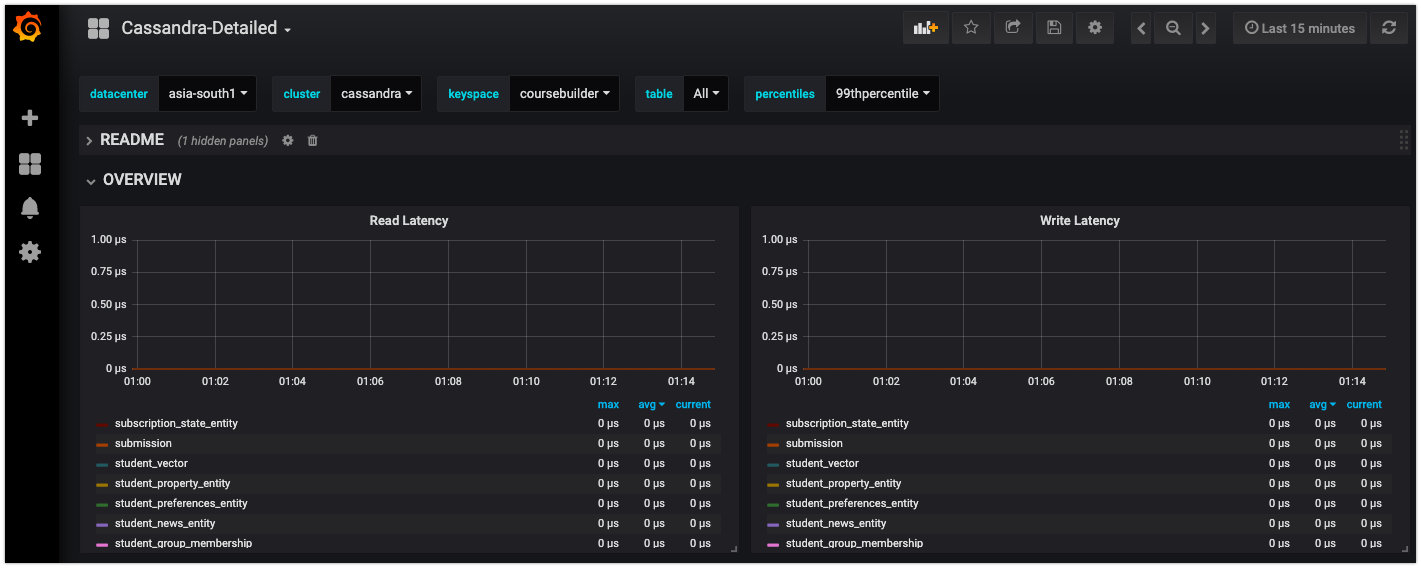
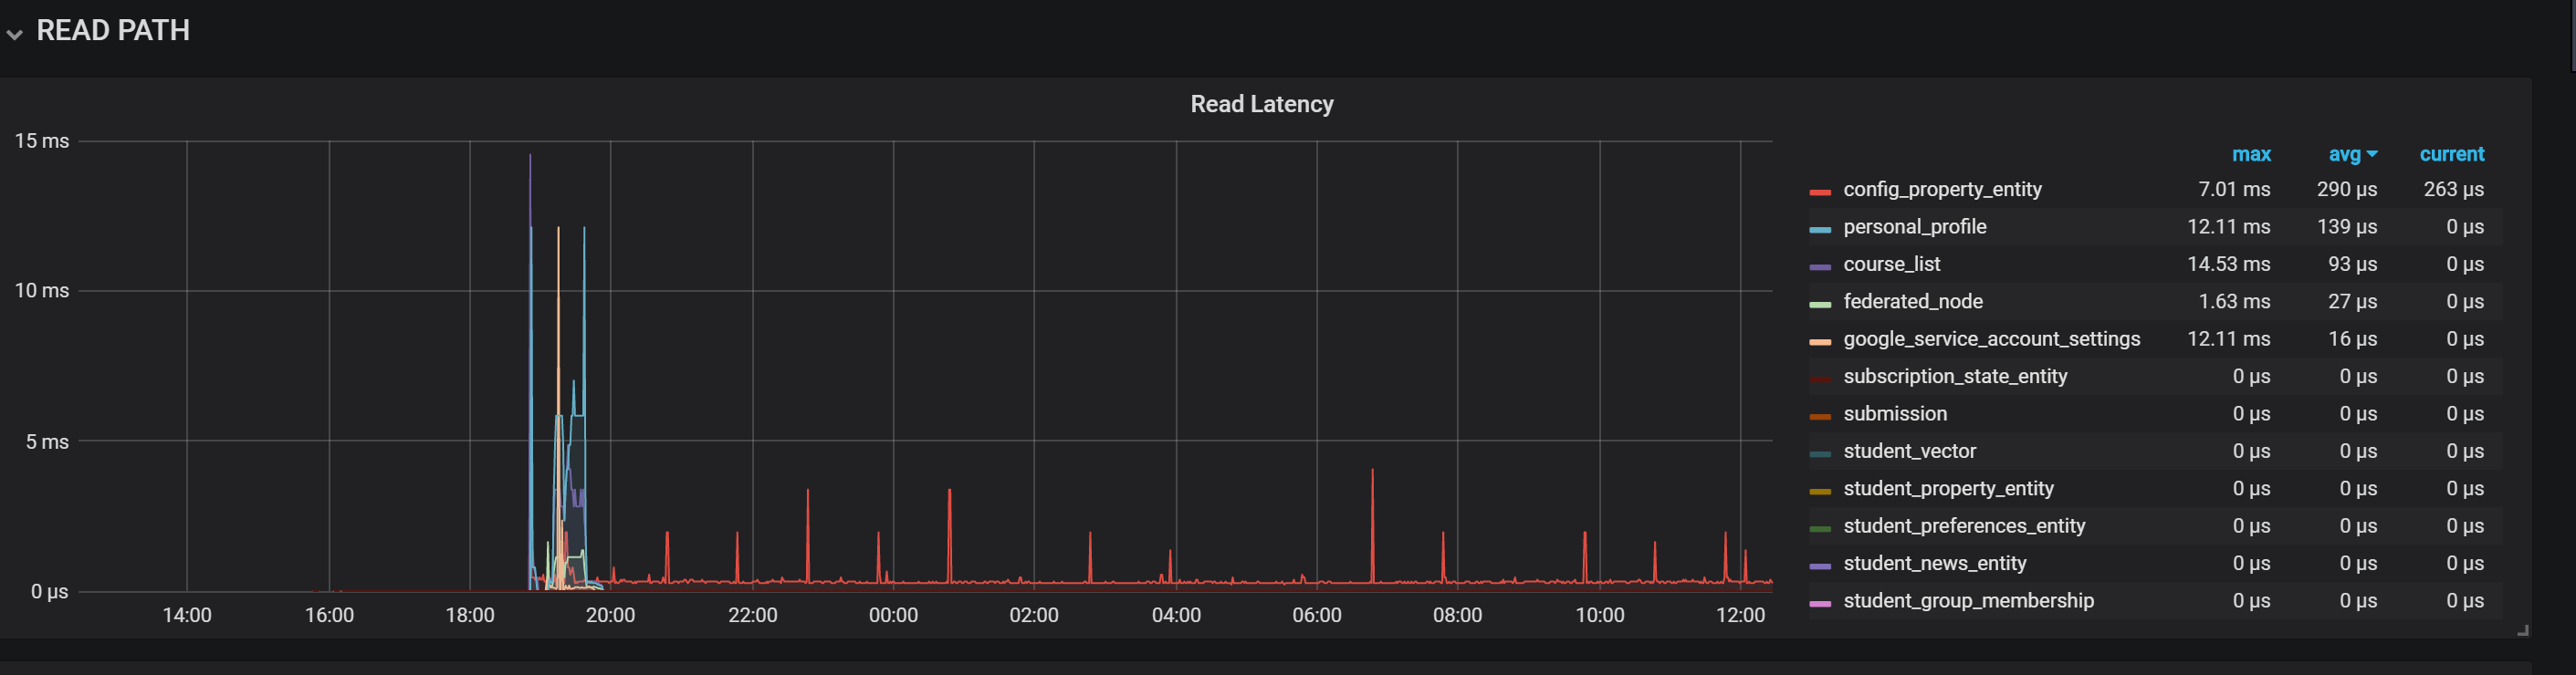
Wait to 5 to 10mins. Then you’ll see the data.
Author’s Comment: #
Generally its not a good practice to scan the metrics very frequently, For my workload 10sec is fine, But do a complete test in your infra before going to prod setup. Also learn more about this custom exporter from here: https://github.com/criteo/cassandra_exporter/